


Pamphlet 29
The Latipac and His Free Market
Now this presentation uses the labels to identify, just who is the beneficiaries of the Free Market manipulation, and who has been severely prejudiced through the increasing cost of living, through the manipulation of the Rand exchange rate, as our Government allowed us to move into the Free Market system, where the Latipac, and some latipac-generators benefited at our expense.
Prior to the Free Market, countries adjusted their currency exchange rate, to generate maximum wealth, for their county, from their resources, materials and labour.
All countries had a system of import and export tariff adjustments, Mercantilism,to protect their local production values, and in turn, maintain an economy, that protected the human, and Latipac-generators.
Donald Trump is moving towards Mercantilism, it is a national economic policy that is designed to maximise the exports, and minimise the imports, of a nation. These policies aim to reduce a possible current account deficit or reach a current account surplus.
Few people, scrutinising the Historical Chart South African Rand Rate chart, pamphlet 19, will ever believe that the Rand was as strong as it was, during the period 1971 to 1983, given that the Country had declared a Republic, changed its currency from English Pound to South African Rands, at an exchange rate of R 2 to one English Pound, and during this period, the June 16, 1976 student massacres takes place, without negatively impacting on the value of the Rand.
This control existed, the ‘State Finance’, pretty simply, adjusted exchange rates, and import and export tariffs, in the interest of extracting maximum wealth, for the Country and its citizens.
This was during the period when the world economy, still regard the human as their most important asset, today, the human has no value.
I summarise the following 2018 Import and Export statistics, and submit the following Conversation / Enlightened Thinking points;
South Africa’s Imports and Exports, off which our GDP is calculated.
Exports, take note of the categories in bold font;
The Beneficiaries of this system, 2018 figures:
1. Precious Metals 17.5%
2. Ores, coal, 12,5%
3. Vehicles 11,4%
4. Mineral Fuels 10.6%
5. Iron steel 6,7%
6. Machinery & Computer 6,2%
7. Fruit and Nuts 3,9%
8. Aluminium 2,2%
9. Electric machines equip 1,9%
10. Plastics 1,5%
Top six import categories, all bought at the manipulated exchange rate, all part of the citizens lives, with the mineral fuels, impacting on everything we consume.
The Citizen’s ‘cost of living’ increased by manipulated exchange rate
1. Mineral Fuels 18,2%
2. Machinery & Computer 12,3%
3. Electric machines equip 9,2%
4. Vehicles 7.6%
5. Plastics 3,0%
6. Pharmaceuticals 2,7%
The top five import categories, are all in the top ten export categories, a very questionable Free Market involvement, I submit that our manipulated exchange rate, is used by the Free Market structure, in order to extract increased wealth for the Latipac.
Our question should be;
“How does the top 5 import categories be in the top ten export categories?”
The manipulation of the Rand/USD exchange rate, benefits the Latipac, a small percentage of the citizens of our country, and Citizens of other Countries, and due to the increased cost of imports, the poverty section cost of living is increasing to beyond break point.
To the children and grandchildren of the Latipac, and all those who have taken advantage of their manipulation of the economy to capture 27% of the world wealth between 1980 and 2016, may I repeat the diagram published in edition 1, by now, you should be embarrassed by your families wealth, embarrassed by their animal behaviour, you should start by apologising to the citizens of South Africa, in particular, those who are human?
From 1980 to 2016, during the Free Market period, the top 1% captured 27% of the total income growth, and the bottom 50%, only captured 12% of the total income growth.
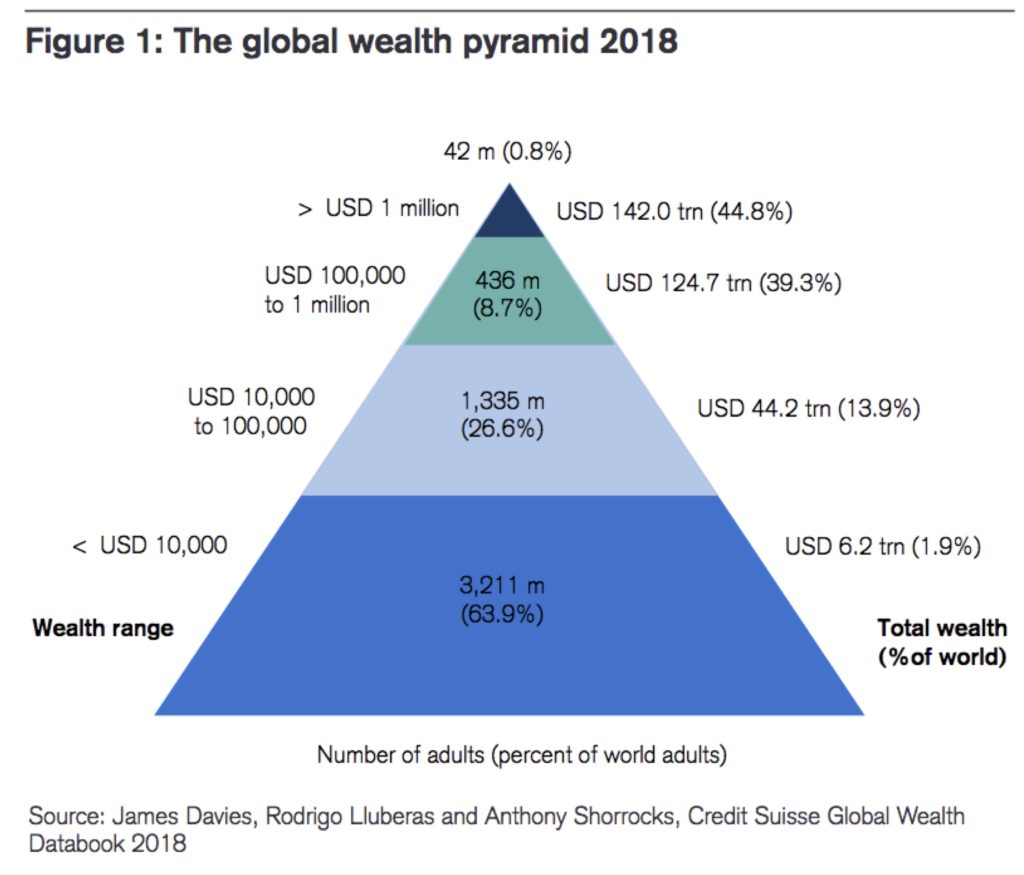
Extrapolating from the diagram, it means that the 52,5 million people representing the top 1%, captured 27% of the total income growth, and the 2 512,5 million people, representing the bottom 50%, captured 12% of the total income growth, the income differential, is that the 1% captured 107,66 times more, than the 50% at the bottom.
Dear Latipac and descendants, I allege that you have captured 27% of the total income growth between 1980 and 2016, directly from the 90% of the lower end of the triangle, and the #LatipacMustFall, the #FreeMarketWillFall.
Cedric de la Harpe
Cedric is available to consult with all interested structures and communities, please email him of safari@tasteofafric.co.za
For the individual who would like to experience the basis of the knowledge that has become his Human Dictate philosophy, please join us for a visit to Soweto or Alexandra; where you will get greater understanding and get closer to the Human Dictate.
Cedric and Nettie de la Harpe